Asset Management System
Automate, track, and optimize your assets with our comprehensive SharePoint-based solution. Streamline assignments, maintenance, and analytics with fully integrated automated workflows.
Download DocumentDeployment Process
Deploy our asset management web part effortlessly within your existing SharePoint environment.
- Step 1: Deploy Package - Upload the
.sppkgfile to the App Catalog and deploy the solution. - Step 2: Add App - Go to Site Contents → Add an App → Select "Asset Management System".
- Step 3: Setup Page - Create a SharePoint page, insert the Web Part, and publish.
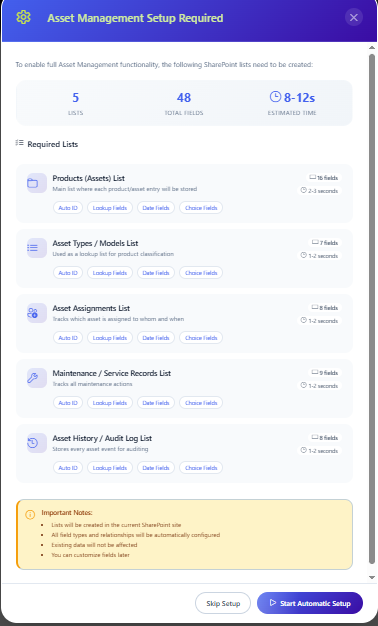
- Step 4: Auto-List Creation - On first load, the system intelligently creates all required structure: Asset Types, Products, Assignments, Maintenance Records, and Asset History.
Main feature overview visual
Key Features & Supported Validations
-
01.
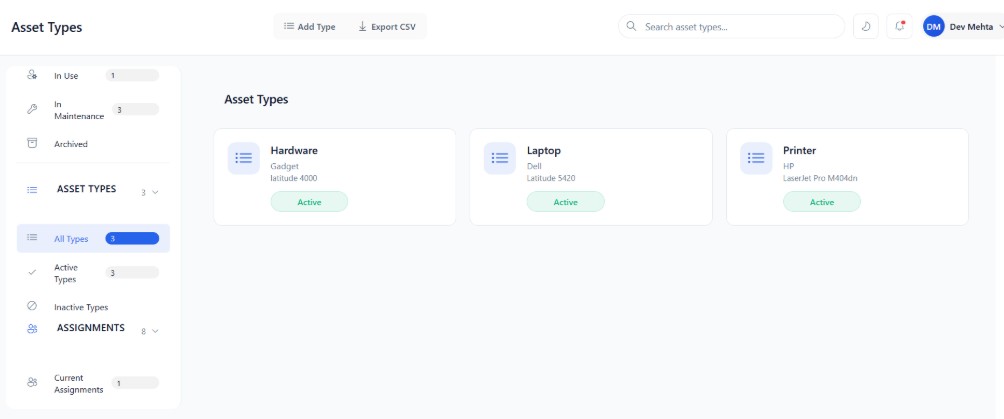
Asset Type & Operations Management
Control categories like Laptops, Monitors, and Mobile Devices. You can easily manage categories and assign them to individual assets. Assets carry their statuses: Available, In Use, In Maintenance, Retired, Disposed.
-
02.
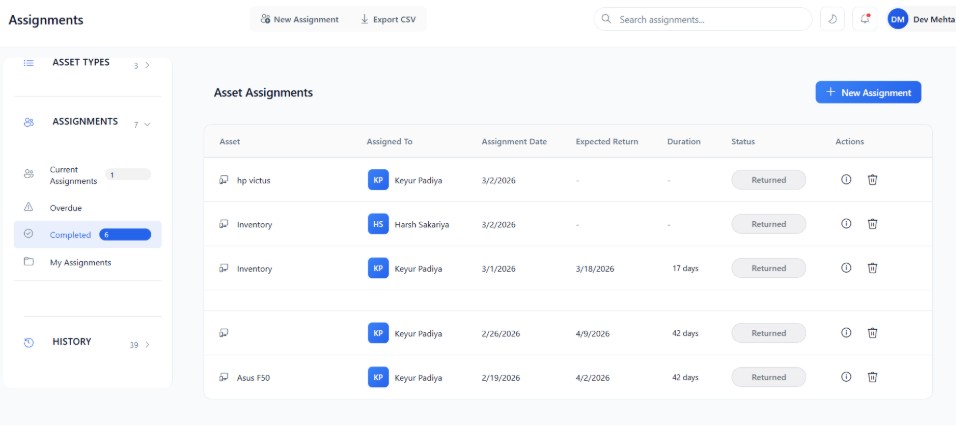
Asset Assignment Logistics
Securely allocate inventory to users. Rigid validations ensure an asset is Available before assignment. Past assignment dates are blocked, and automatic status toggles shift the asset back to Available when correctly returned.
-
03.
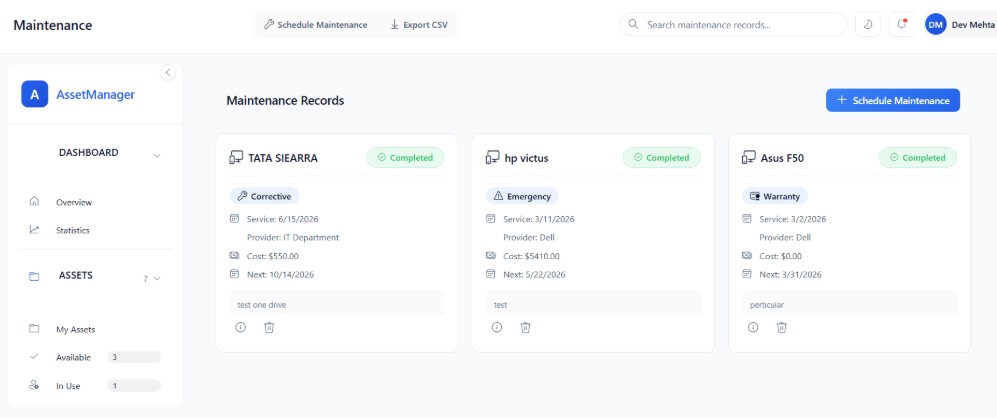
Maintenance Workflow
Track maintenance with an enforced state flow: Planned → In Progress → Completed / Cancelled. Features logical cost tracking (value 0 for warranty) and denies scheduling for retired or disposed resources.
-
04.
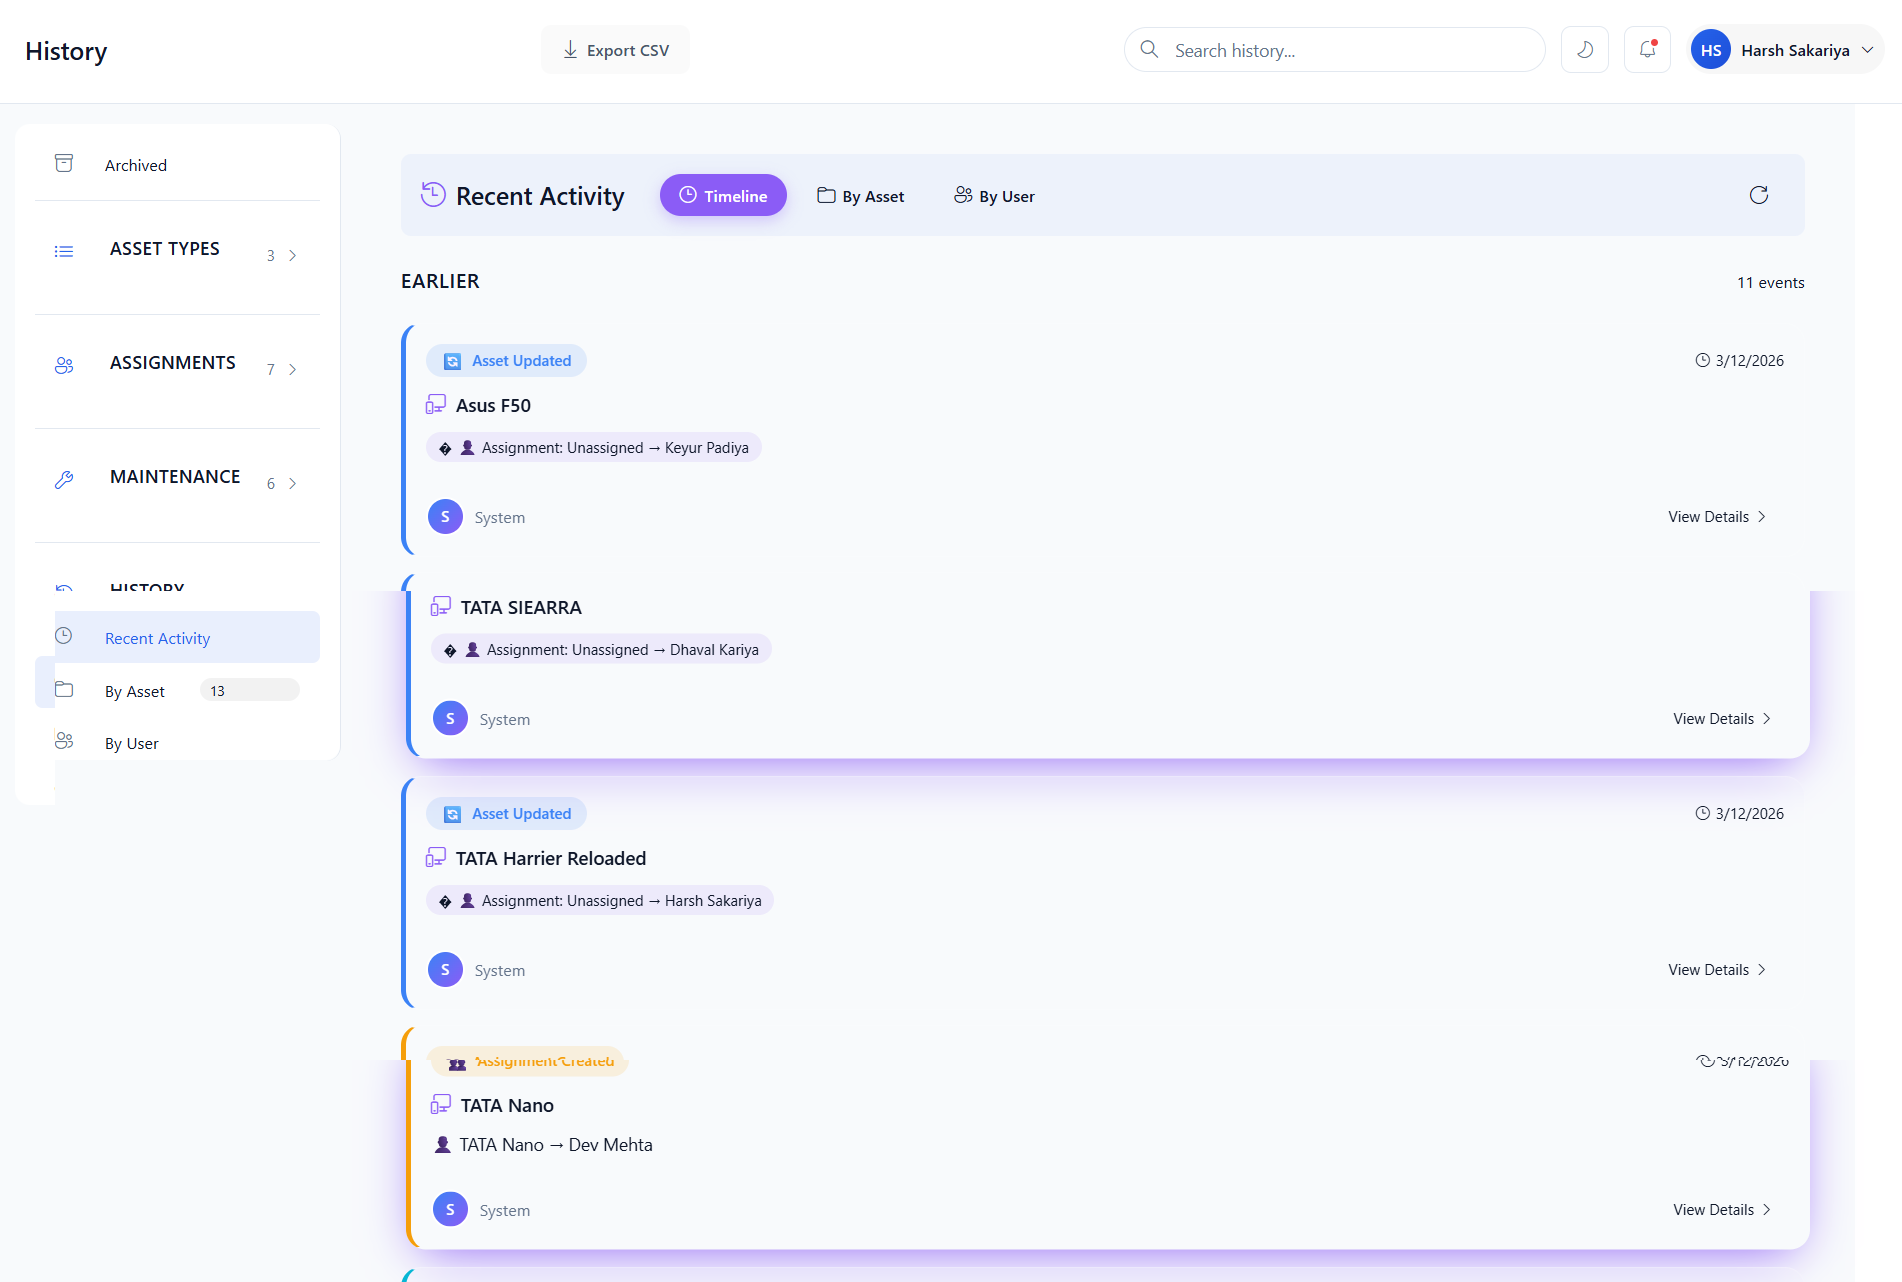
History & Validations Tracking
Maintains absolute transparency. All interactions—from creation and assignments to final disposal—are actively recorded. Asset deletions are strictly prohibited if possessing active bindings.
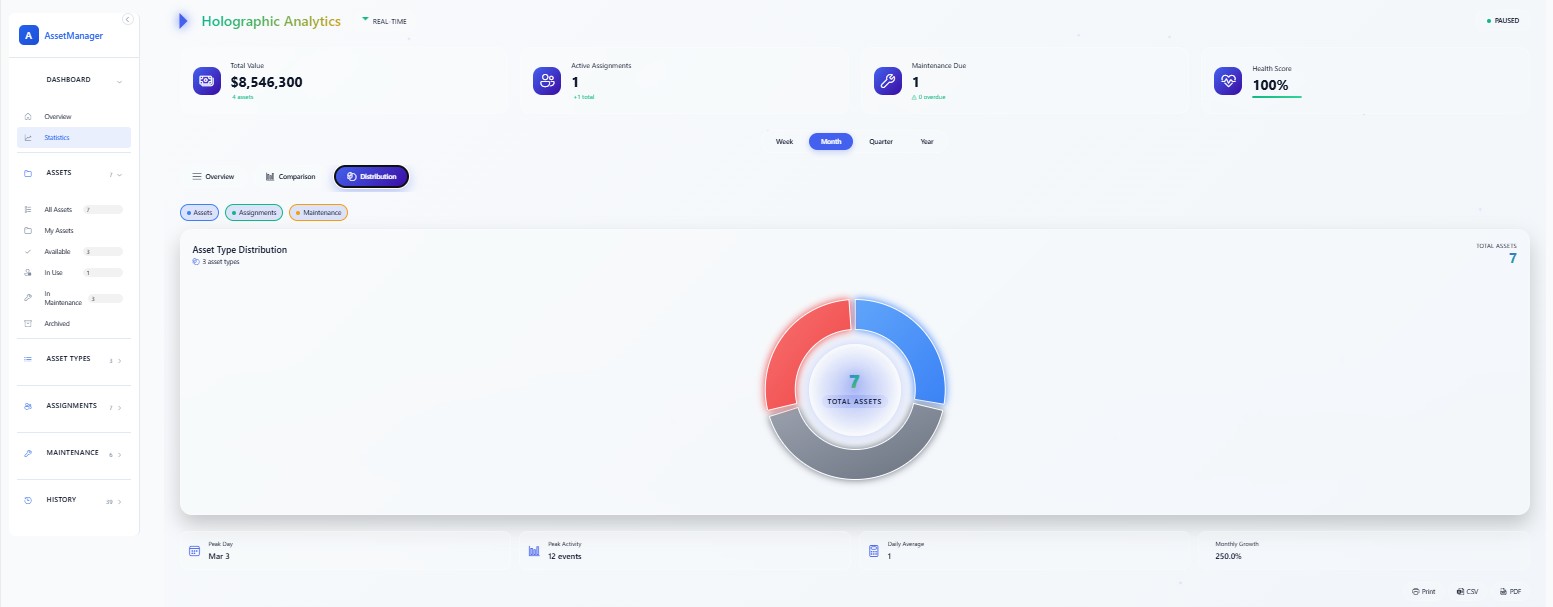
Analytics & Reporting Dashboard
Visualize system health, total portfolio value, and utilization rates securely in one place.
Donut Chart 📊
Distributes the volume of Available vs In Use assets beautifully. Hover for exact numbers.
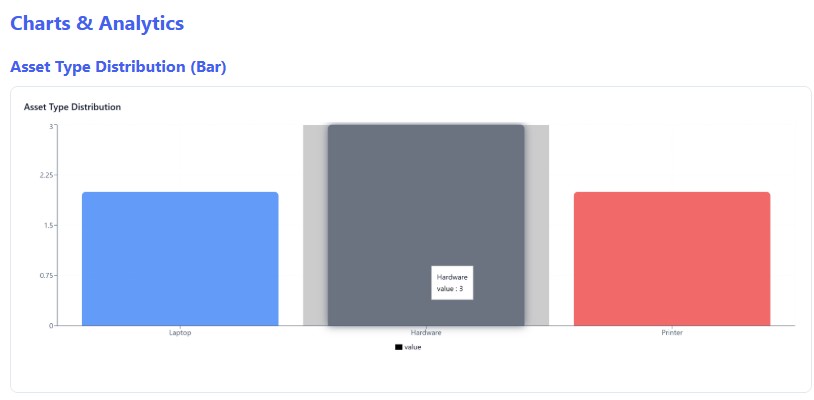
Bar Chart 📊
Compares asset statistics or counts. Very useful to observe category metrics rapidly.
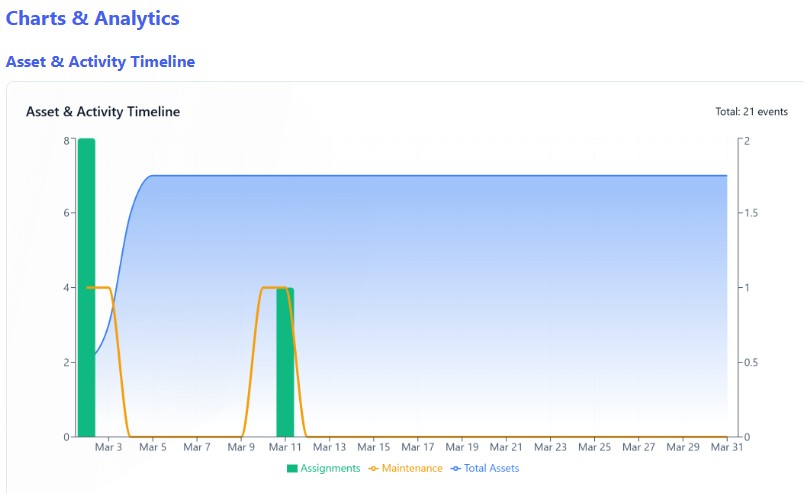
Activity Timeline 📈
Maps trends over flexible timeframes (Week/Month/Year) indicating assignment vs maintenance flux.
Data Export Functionality
Export filtered listings outright to CSV formats. Take data representations forward by printing the entire dashboard out, converting visual graphics to structured PDF elements, or dynamically sharing intelligence summaries using modern Web Share integrations.